
If you’ve spent any time on our Velocity Banking and Infinite Banking service pages, you already know the two strategies fit together. What most people never get is an honest answer to the next question: how long does this actually take, in real years?
Not “debt-free by next spring.” Not “your policy doubles in five years.” Just a straight walk through what a combined plan tends to look like, stage by stage, so you know what you’re actually signing up for before you start.
A Realistic Debt-Free Combined Strategy Timeline, Year by Year
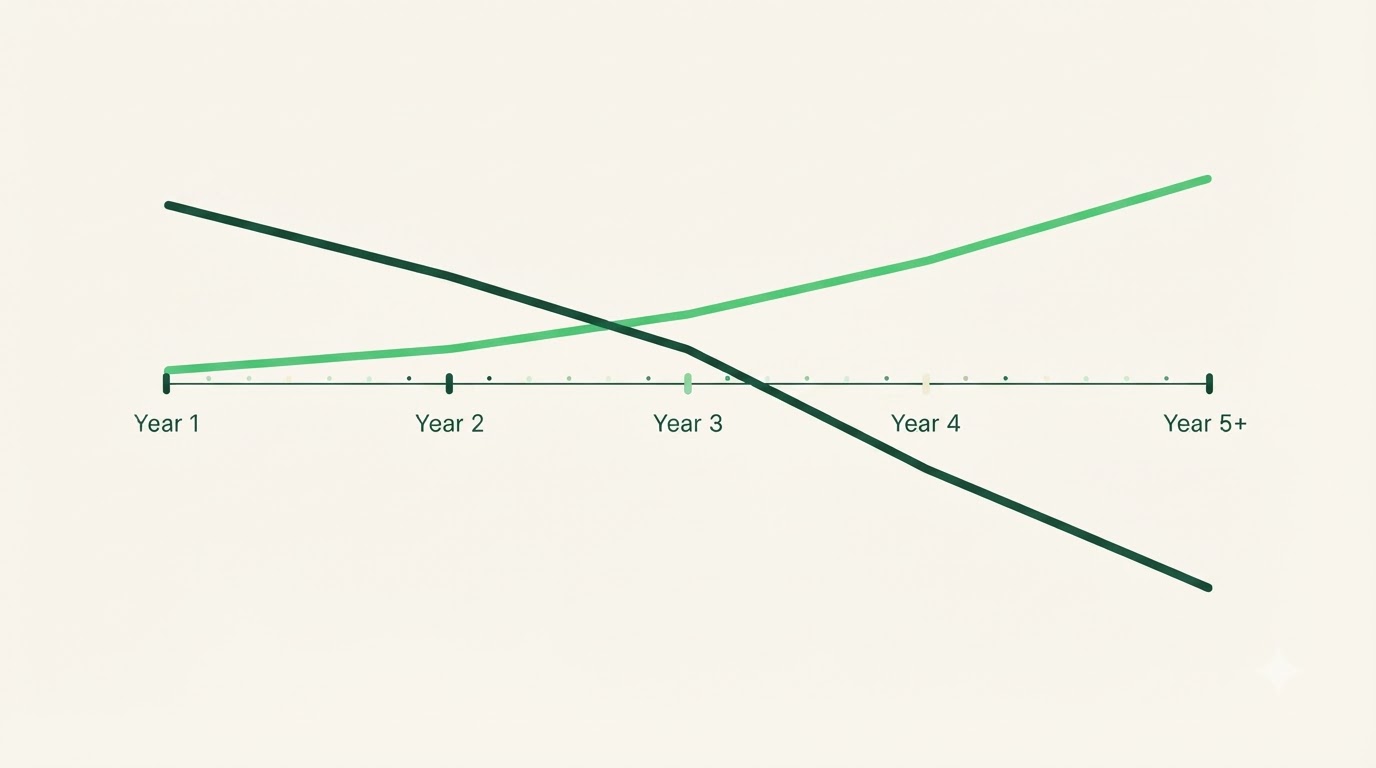
Here’s the shape of a combined plan from year one through year five and beyond — where the two strategies overlap, where they diverge, and when you’d realistically start seeing capital you can actually use.
Year 1: Two Things Moving at Different Speeds
In year one, you’re usually running Velocity Banking and a new whole life policy at the same time, and they don’t move at the same pace. Velocity Banking starts working almost immediately, since it’s just a change in payment timing on debt you already owe — split a monthly payment across a few dates instead of one lump sum, and the reported balance and the interest calculation both improve within that first cycle. The policy is the slow one. A properly designed policy can direct a large share of first-year premium toward cash value, but “large share” still isn’t much in dollar terms when you’ve only made a handful of payments. That’s normal, not a sign anything’s broken.
This is also the year most people underestimate how much patience the policy side requires. You’ll see statements, illustrations, and dividend schedules, and none of it looks dramatic yet. Meanwhile the debt-elimination side is doing the visible, satisfying work — balances dropping, due dates getting easier to manage. The policy is quietly banking something you can’t buy back later: time. Every year a policy is in force before you need to lean on it is a year that compounds in your favor down the road.
Years 2–3: Debt Comes Down, the Policy Wakes Up
This is usually when things start feeling real. Revolving balances that looked stubborn in year one start dropping in a visible, trackable way, especially once a card or two gets fully cleared and that payment rolls into the next target. On the policy side, cash value growth typically picks up here too. Industry data on properly designed policies puts break-even — where your total cash value finally catches up to what you’ve paid in — somewhere between year three and year six for most people, which lines up with what we see with our own clients. You’re not rich in cash value yet. You’re past the flattest part of the curve, which matters more than it sounds like.
Years 3–5: The Policy Starts Pulling Its Own Weight
Somewhere in this window, for a well-designed policy, the cash value crosses a line where it’s usable — not huge, but usable. That’s when policy loans stop being a theoretical feature you read about and start being an actual capital source: a real repair, a down payment on a rental, paying cash for something instead of financing it through a bank. You’re still not done with the debt side, in most cases. But you’re not just paying debt down anymore. You’re starting to build a second lever, and the two start reinforcing each other — freed-up cash flow from cleared debt can go straight into funding the policy further, which shortens the wait for the next usable dollar of cash value.
| What It Does | Velocity Banking | Infinite Banking Strategy |
|---|---|---|
| Primary role in the timeline | Eliminates revolving debt faster | Builds a usable pool of capital |
| When results typically show up | Within the first billing cycle | Usually years 3–6 for real usability |
| What it uses | Existing revolving credit accounts | A properly designed whole life policy |
| Role after debt is paid off | Frees up monthly cash flow | Becomes the ongoing banking system |
Year 5 and Beyond: From Elimination to Ownership
Past year five, for most people who’ve stayed consistent, the mission changes. The early years were about getting out from under interest payments and getting a policy funded enough to matter. This stage is about using the system you built instead of just building it. Policy loans start funding things that used to go on a credit card or through a bank loan — and every dollar you borrow against your own cash value keeps earning dividends the whole time it’s out, on a well-designed policy, instead of just sitting there while a bank collects your interest. This is the “become your own banker” part people hear about early and don’t fully understand until they’re actually living it.
Why Your Timeline Won’t Match Anyone Else’s
Every number above is a range, not a promise, because the inputs are different for every household. Your starting debt load, your interest rates, how much extra cash flow you can redirect each month, how your policy is designed, which carrier you’re with, your health rating at underwriting — all of it shifts the timeline in one direction or another. Someone with $8,000 in card debt and strong monthly cash flow moves through year one very differently than someone carrying $40,000 across six cards on a tighter budget. Neither person is doing it wrong. They’re just on different maps.
This is also where a lot of the frustration on social media comes from — people comparing their month six to someone else’s year four and assuming they’ve failed. They haven’t. They’re just earlier. Your credit profile matters too: better credit generally means better loan and balance-transfer options while you’re eliminating debt, which is part of why we look at your credit picture before mapping out a strategy, not after.

Watch for the Same Mistakes That Slow Everyone Down
A few missteps show up over and over along this timeline, and they’re worth knowing before you hit them instead of after. If your credit profile isn’t in solid shape yet, start with our breakdown of what to fix first before you begin Velocity Banking — the short version there, and elsewhere: underfunding a policy so it never builds real cash value, stopping Velocity Banking payments the moment life gets busy, and expecting month-three results from a strategy that’s designed to compound over years. Every one of these is avoidable once you know to look for it, which is the entire point of catching them early instead of three years into the plan.
Track Your Own Plan, Not Someone Else’s Testimonial
The most useful thing you can do isn’t finding someone else’s before-and-after and trying to match their pace. It’s writing down your own starting numbers — total debt, current interest rates, your policy’s illustrated values — and checking your actual progress against that baseline every few months. According to Nasdaq’s financial planning desk, long-term financial goals are typically measured over five, ten, or more years, precisely because meaningful progress doesn’t show up on a weekly or even monthly basis. Your timeline is the only one that matters for your decisions. Everyone else’s is just a data point, not a deadline.
The years, ranges, and figures above are illustrative examples based on general industry patterns, not a quote, guarantee, or projection for any specific policy or financial situation. Actual results depend on your individual debt, income, credit, and policy design.
See Your Own Debt-Free Combined Strategy Timeline
Every plan above is a general shape. Yours has actual numbers behind it — your debt, your income, your credit, your health rating. Book a call with our team and we’ll map out what your specific multi-year timeline could realistically look like.
Book a Strategy Call